Beyond the Point Forecast Launching WorldSim, a 6-Layer Simulation Engine for 195 Countries
A flight simulator for economic policy. Probabilistic, reproducible, EU-built.

Every serious forecast you have read about Europe in the last decade came as a single line. The IMF says Italian debt falls to 128% by 2030. The European Commission says French unemployment stabilises at 7.2%. The OECD says Spain’s productivity grows at 0.9% a year. None of these are wrong. All of them hide the thing that actually matters.
A single line compresses out the tail. It tells you nothing about how wide the uncertainty is, how the shock propagates when one indicator moves, or whether the numbers are structurally compatible. Real economies do not behave like point forecasts. When inflation rises interest rates respond, which affects housing, which affects migration, which affects the labour market. The coupling is where the economics lives, and that is exactly what gets lost when every indicator is forecast on its own line.
WorldSim is my attempt to put the coupling back. Today we are launching publicly.
What WorldSim is
WORLDSIM is a probabilistic socio-economic world simulation platform for long-horizon scenario exploration through controllable, reproducible synthetic environments.
In plain English: you pick a country, set conditions, and the engine runs 10,000 Monte Carlo trajectories across 26 indicators connected by 100+ structural coupling rules. The output is a probability distribution, not a single forecast. Think of it as a flight simulator for economic policy. It is live at worldsimlab.com.
The problem we are solving
No controlled environment exists today to simulate a country. That gap shows up in three places.
1. No playground to experiment with policy
A ministry wants to reduce debt. They try 1%, 2%, 3% reductions, each time watching what happens to employment, housing, inflation, and social stability across a 10-year horizon. That iterative experimentation, before touching a single real policy lever, is not possible anywhere today. Ministries either commission a €50k to €200k bespoke model over 3 to 6 months, or they read a pre-packaged forecast subscription that does not let them change the assumptions.
2. Cross-KPI interactions are invisible
A government mandates 40% renewable energy by 2035. That decision immediately affects electricity prices, household cost stress, inflation, industrial competitiveness, unemployment in energy-intensive sectors, and fiscal pressure. All moving together. No existing tool models that structural chain across a long horizon. The coupling is where the real economics lives, and it is exactly what gets lost when each KPI is forecast in isolation.
3. AI systems need reproducible socio-economic environments
EU AI Act Regulation 2024/1689 (deadline 2 August 2026) requires high-risk AI systems (credit scoring, labour-market tools, social benefit algorithms, GPAI systemic-risk assessment) to be stress-tested across diverse, controllable macro environments before deployment. Those environments do not exist at the scale the regulation demands, and a GAN will not produce them because GANs are unconstrained. Structurally coherent synthetic data is the missing piece, which is exactly what WorldSim generates.
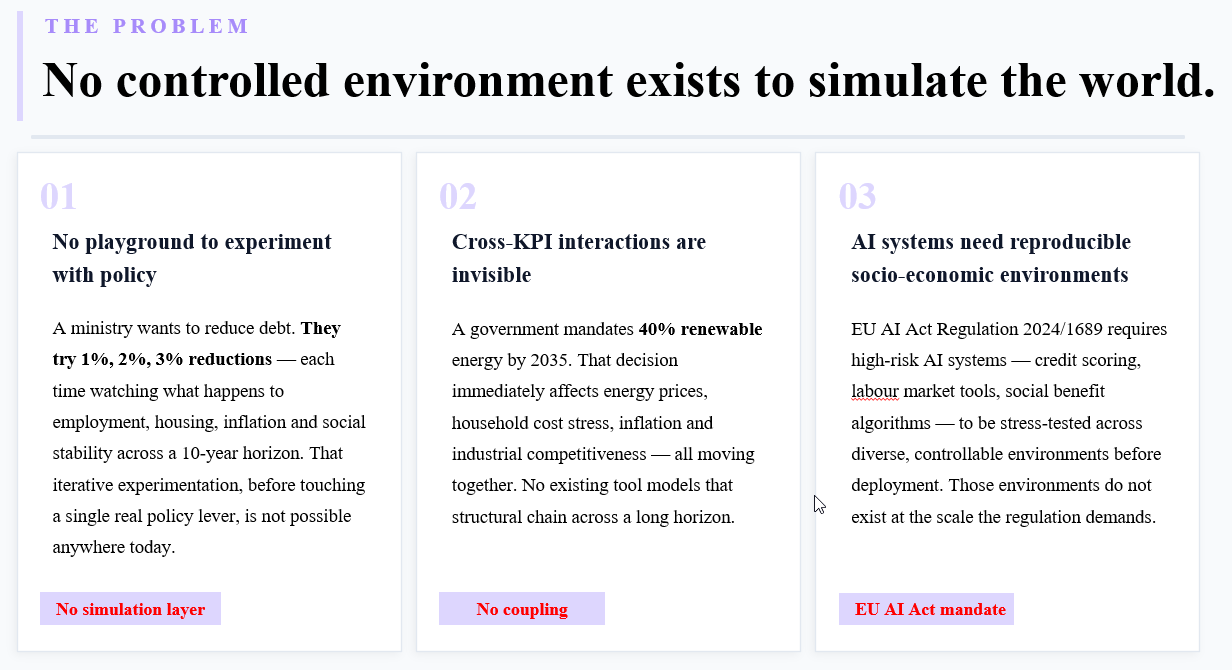
Three-card problem graphic from the landing page
How it works: the six layers
Each simulation pass flows through six sequential layers. The output of every layer feeds the next.
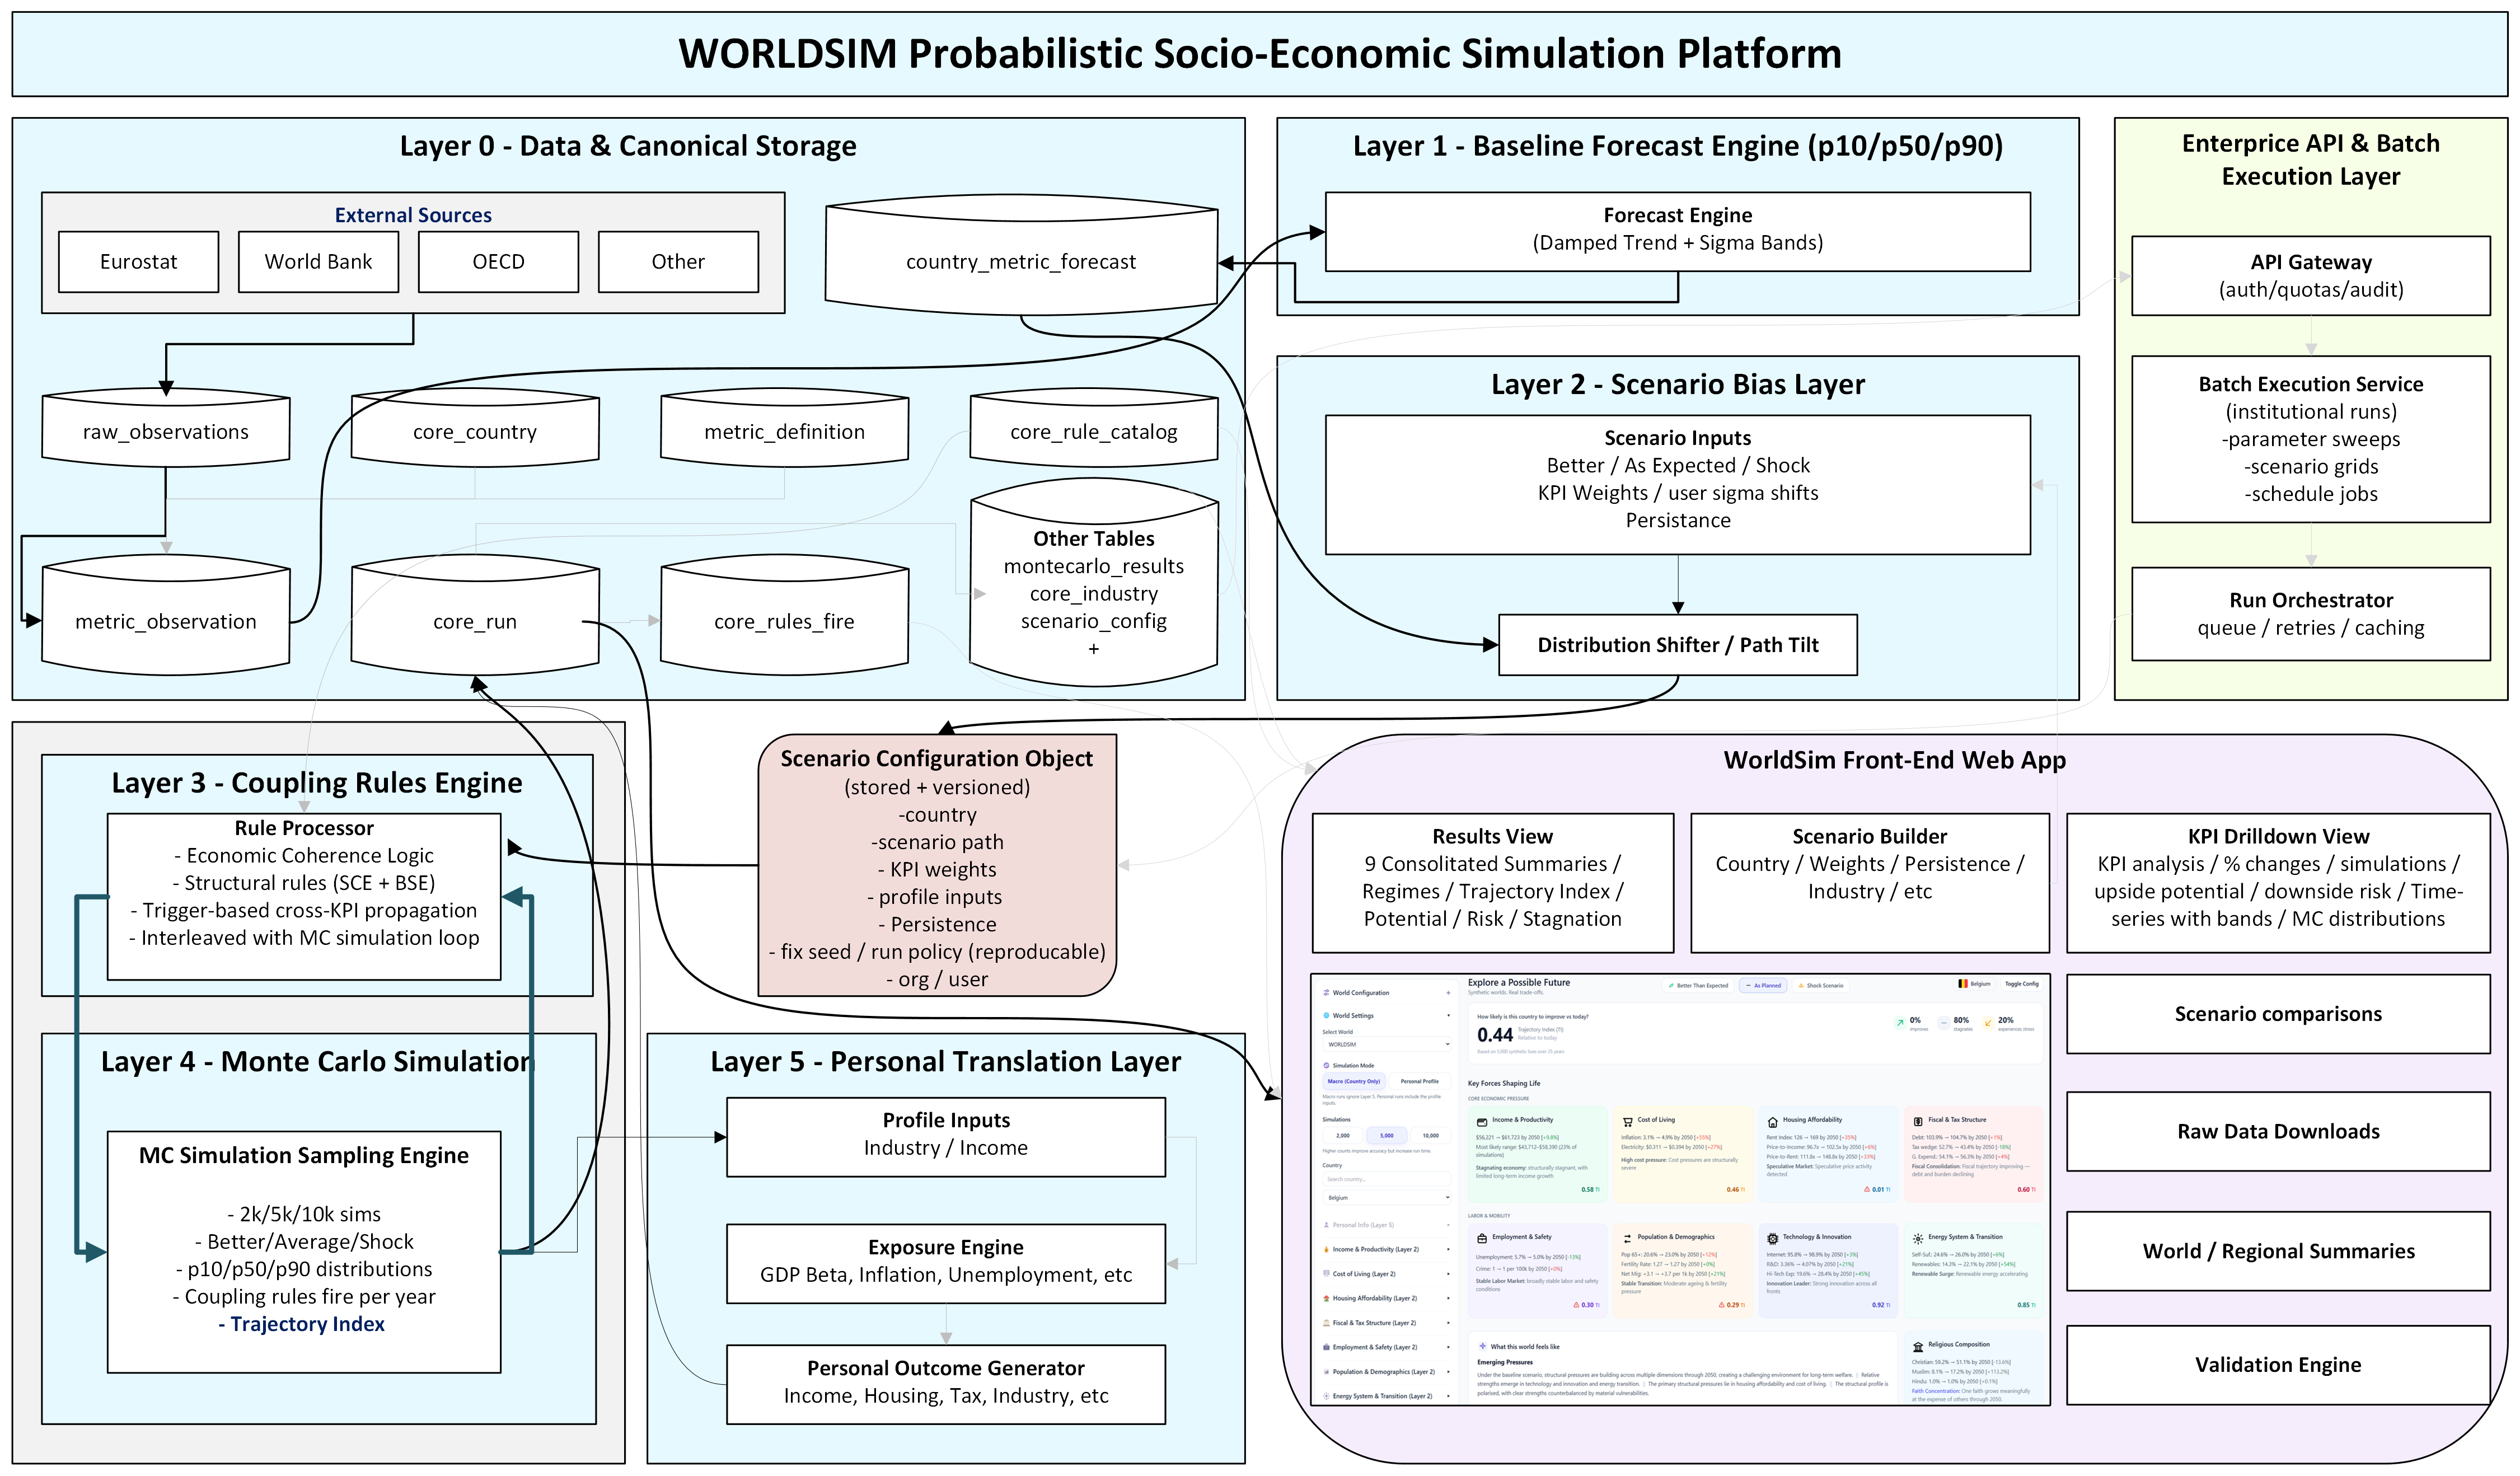
Layer 0 — Canonical Data
Historical observations for 195 countries, harmonised from the World Bank, IMF, OECD, Eurostat, and UN Population Division into a single canonical schema. This ensures that when you compare Greece to Ireland, you are comparing apples to apples.
Layer 1 — Baseline Forecast Engine
For each of the 26 indicators, the engine projects a baseline trajectory to 2050 using damped-trend methodology. Instead of a single line it produces three: P10 (pessimistic), P50 (median), and P90 (optimistic). The width of the envelope reflects each country’s historical volatility.
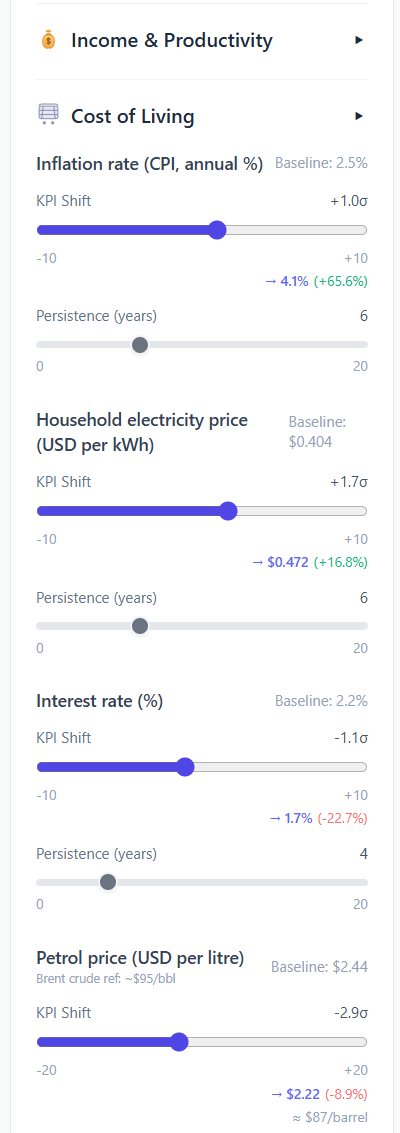
Layer 2 — Scenario Bias
This is where policy scenarios are tested. Users push any indicator up or down in sigma units (standard deviations), with configurable duration, persistence, and decay. ‘What if energy prices rise 50% for three years?’ ‘What if we cut the tax wedge by 5%?’ The engine carries the shock forward.
Layer 3 — Coupling Rules Engine (Core IP)
100+ structural rules model how economic indicators interact. Each rule has a trigger condition, effects on related indicators, duration, lag, persistence, decay, mean reversion, scars, and an academic citation. They enforce causal coherence so cascades through GDP, unemployment, inflation, housing, migration, fiscal, energy, and demographics propagate realistically across the full 25-year horizon.
To make this concrete, here is one cascade the engine runs on its own once an oil shock is tilted in:
Oil price crosses $2.00 per litre, Fuel Pressure rule fires, transport and logistics costs rise, inflation pushes upward, interest rates respond, mortgage costs rise, housing affordability deteriorates, net migration declines as workers leave for cheaper countries, the labour market tightens, and GDP adjusts. Every step is a named rule with a reference you can click through.
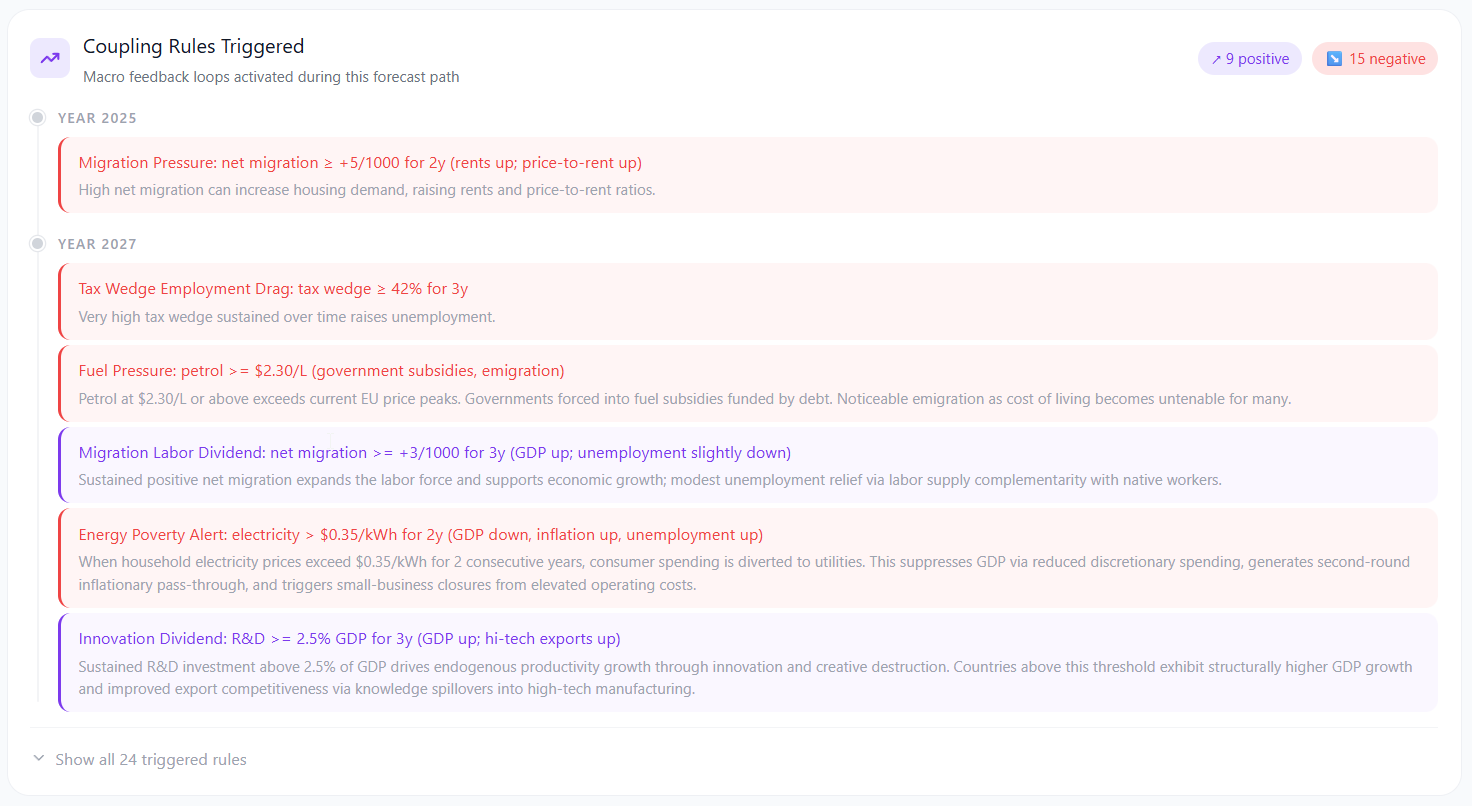
Coupling rules timeline: which rules fired in which year for a sample run
Layer 4 — Monte Carlo Simulation
10,000 trajectories per scenario. Every path obeys Layer 3’s coupling rules, but small random draws produce a spread of outcomes. The result is a full distribution that shows the tails, the skew, and the probability of different outcomes. A right-skewed distribution tells you something fundamentally different from a left-skewed one, even when both have the same median. That is the information single-point forecasts hide.
Every simulation is deterministic per seed and run group ID. The same configuration always produces the same trajectories, which matters for institutional audit trails and regulatory compliance.
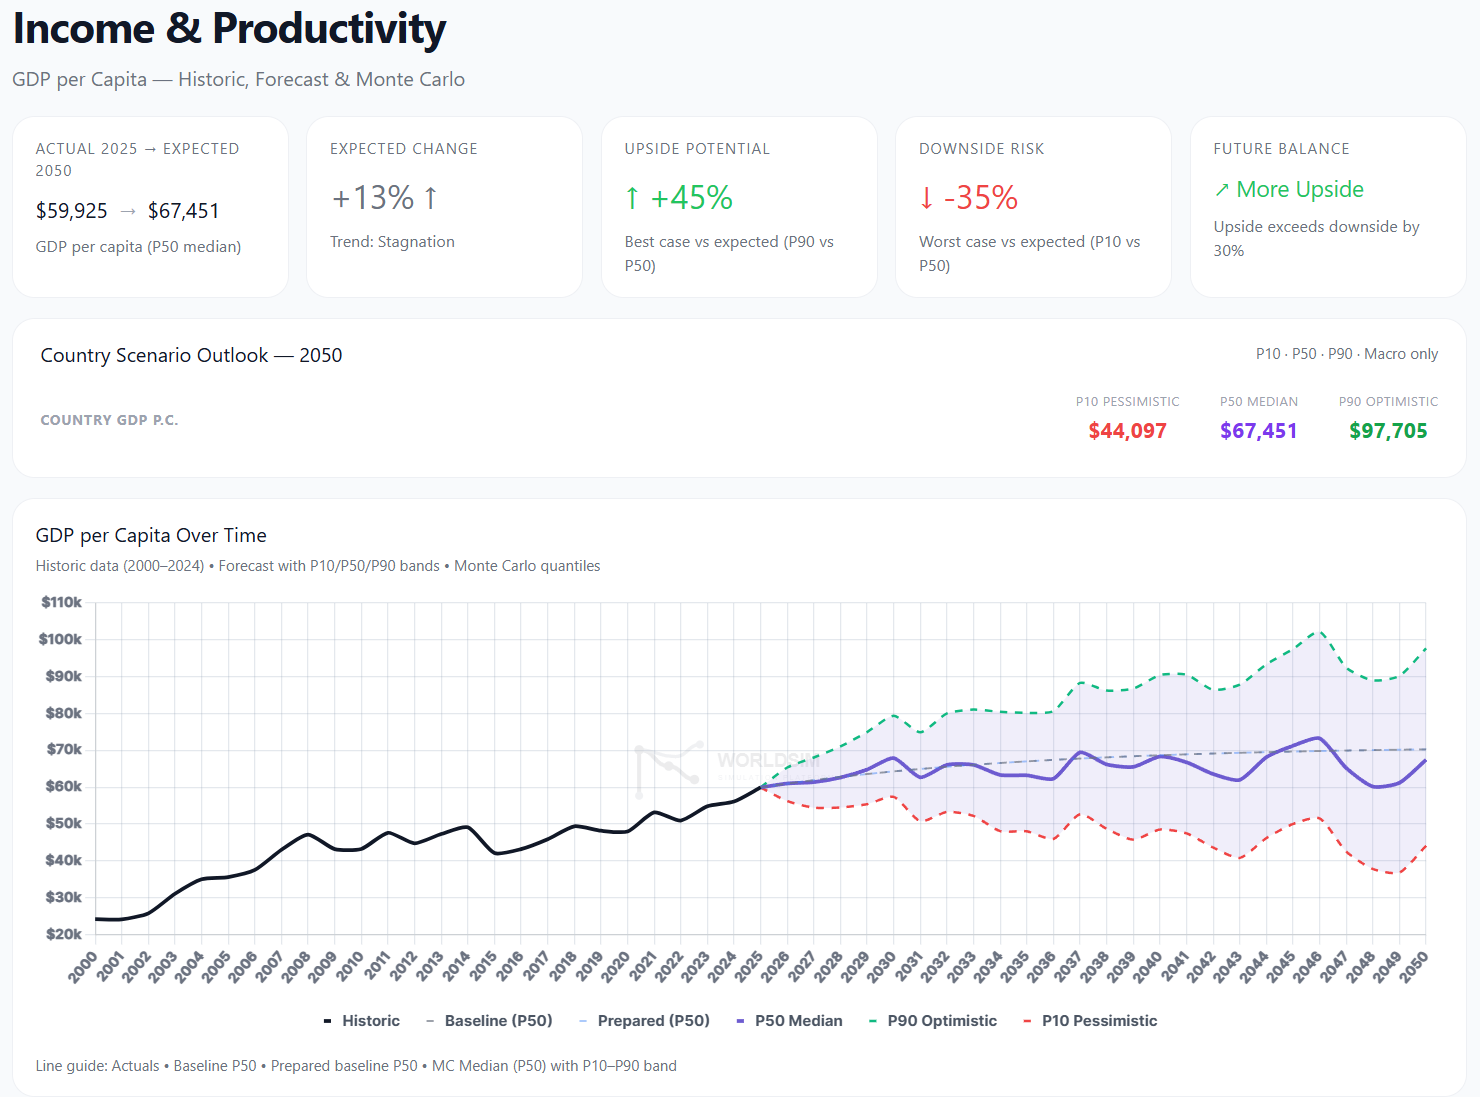
Fan chart: P10 / P50 / P90 trajectory for a flagship KPI
Layer 5 — Personal Translation
The final layer maps macro trajectories to household outcomes. Enter an age, profession, country, and salary, and the engine translates the structural scenario into personal projections: purchasing power, income, housing affordability (home price, rent, mortgage as a share of income), and employment risk. This is what makes the macro tangible.
Questions WorldSim answers
· Can Greece survive $110 a barrel for 4 years? What is the socio-economic impact?
· What is Spain’s average house price, monthly rent, mortgage, and price-to-income if net migration stays above +13 per 1,000 for 10 years?
· Bulgaria vs Romania under identical shock conditions: which economy is more structurally fragile, and why?
· If electricity exceeds $0.40 per kWh for 7 years, what happens to Germany’s economy, inflation, real wages, and migration flows?
· Poland’s 65+ share rises from 19% to 35% by 2050: does GDP per capita still double, or does ageing drag kill it?
· What does the median Lisbon rent and purchasing power look like in 2035 for a teacher on €21,600 today?
· Germany vs Poland vs Romania for a 15-year manufacturing site: which has the best structural cost position once energy, tax, demographics, and labour are coupled?
How WorldSim differs from what exists today
The existing scenario-analysis landscape is excellent at what it does, and it is almost entirely US-based: Oxford Economics, Moody’s Analytics, S&P Global, Bloomberg, Refinitiv, plus the IMF’s own DSGE models (GIMF, FSGM). WorldSim is built as the EU alternative, and the architecture is deliberately different:
· Parameter-controlled scenarios. You move the sliders, the engine reruns. No waiting for a vendor to publish next quarter’s scenario set.
· Full distributional output. P10 to P90 per KPI per country per year, not a single line.
· Coupling surfaced. Every rule that fires in a simulation is visible, with its trigger, academic reference, and effect magnitude. Nothing is hidden inside a black-box model.
· Unified cross-country engine. The same 100+ rules run on all 195 countries, so comparisons across the EU or across continents are one click, not weeks of bespoke calibration.
· Reproducible by design. Every run is deterministic per seed and run group ID. This is the architecture EU AI Act compliance and central-bank governance both require.
· EU-built, EU-hosted, EU-governed. For institutional buyers that matters on data sovereignty, procurement, and AI Act alignment.
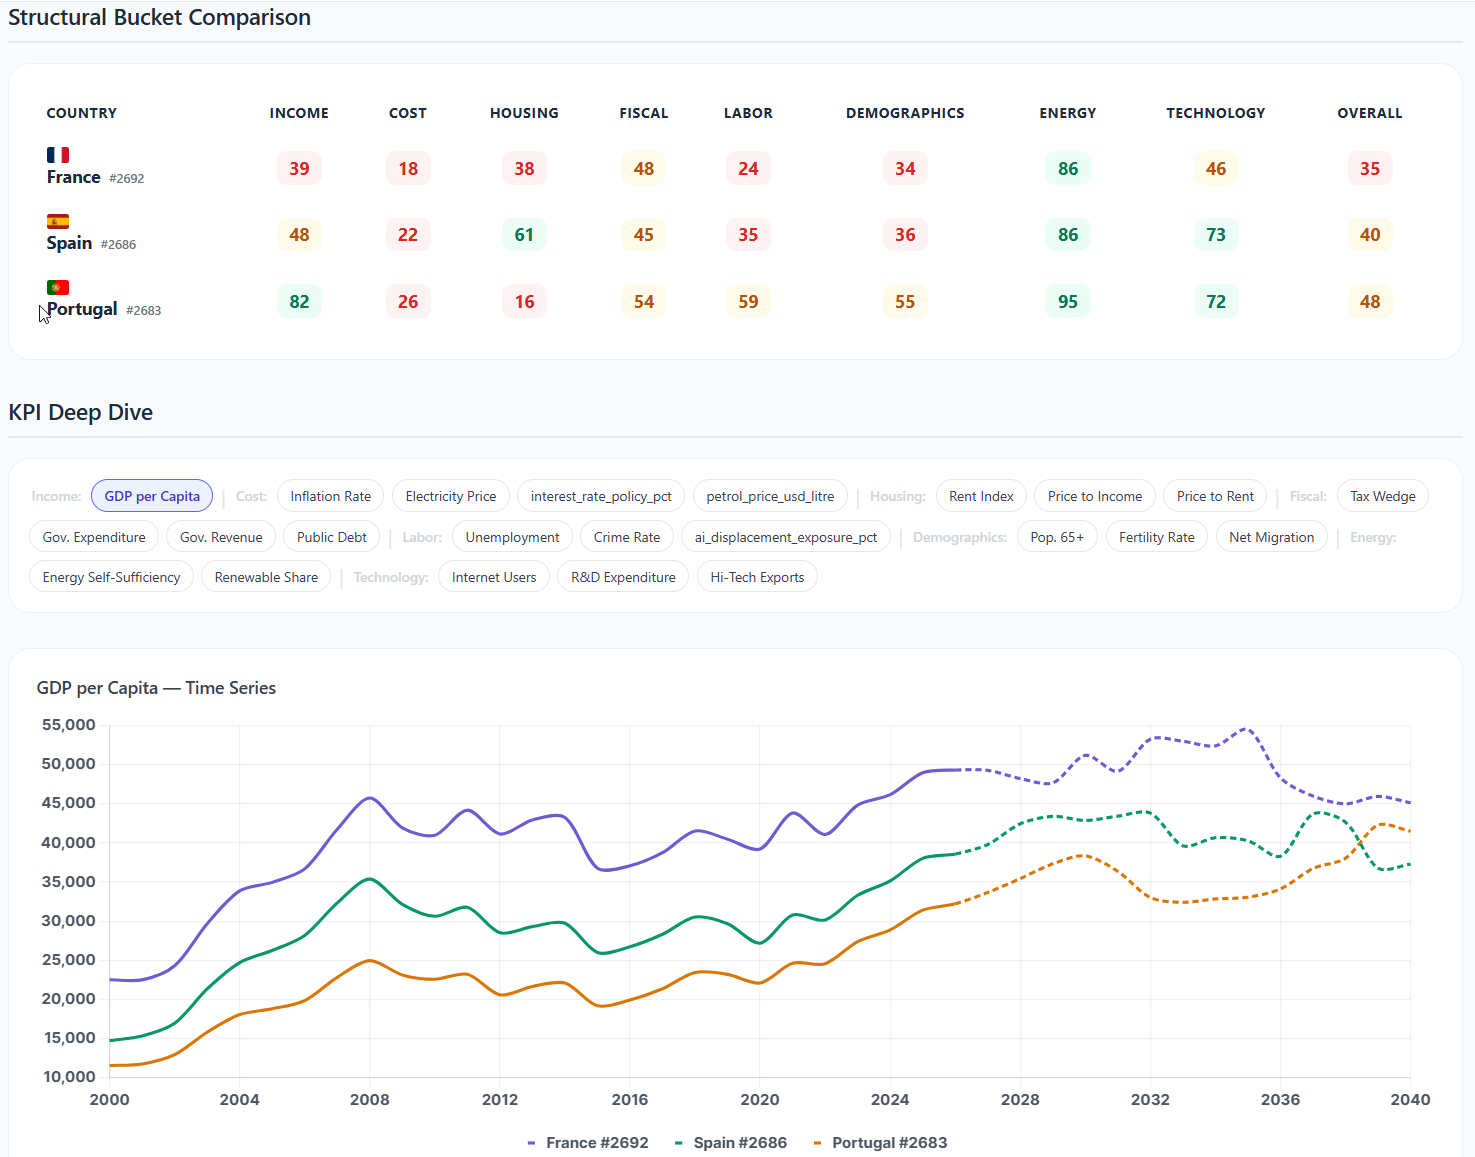
Comparison engine: countries side-by-side under identical conditions
Who we built it for
· Public sector: governments, treasuries, central banks, multilaterals (IMF, OECD, ECB, EU Commission). Long-horizon fiscal and demographic stress-testing with full reproducibility.
· Private sector: hedge funds, macro investors, corporate strategy teams. Country tail-risk quantification and 15-year site-selection analysis with coupling effects baked in.
· AI and compliance: AI / data teams training credit, insurance, and portfolio models on structurally coherent synthetic macro data, plus EU AI Act robustness testing ahead of the Aug 2026 deadline.
Validation and public engagement
WorldSim includes a built-in Validation Engine. We set a historical cut-off (2015), run the simulation forward, and compare the simulated distributions against what actually happened from 2016 to 2024. That nine-year period includes COVID, the Ukraine war, the 2022 energy crisis, and the 2022 to 2023 ECB hiking cycle. It is the hardest stress window modern European macro has.
Across 17 EU countries, distributional coverage (share of years where the realised value falls within the P10 to P90 band) lands between 77% and 89%. Directional accuracy is 63% to 86%. The bands held through three consecutive structural shocks without recalibration.
Beyond backtests, validation lives in public. Seven published country analyses so far have generated over 300 comments, including substantive methodological critique from economists and researchers. Last week a Redditor flagged the Phillips rule as missing a regime gate; we shipped the fix the next morning. The full coupling-rule catalog is published at worldsimlab.com/coupling-rules and pushback is handled in the open.
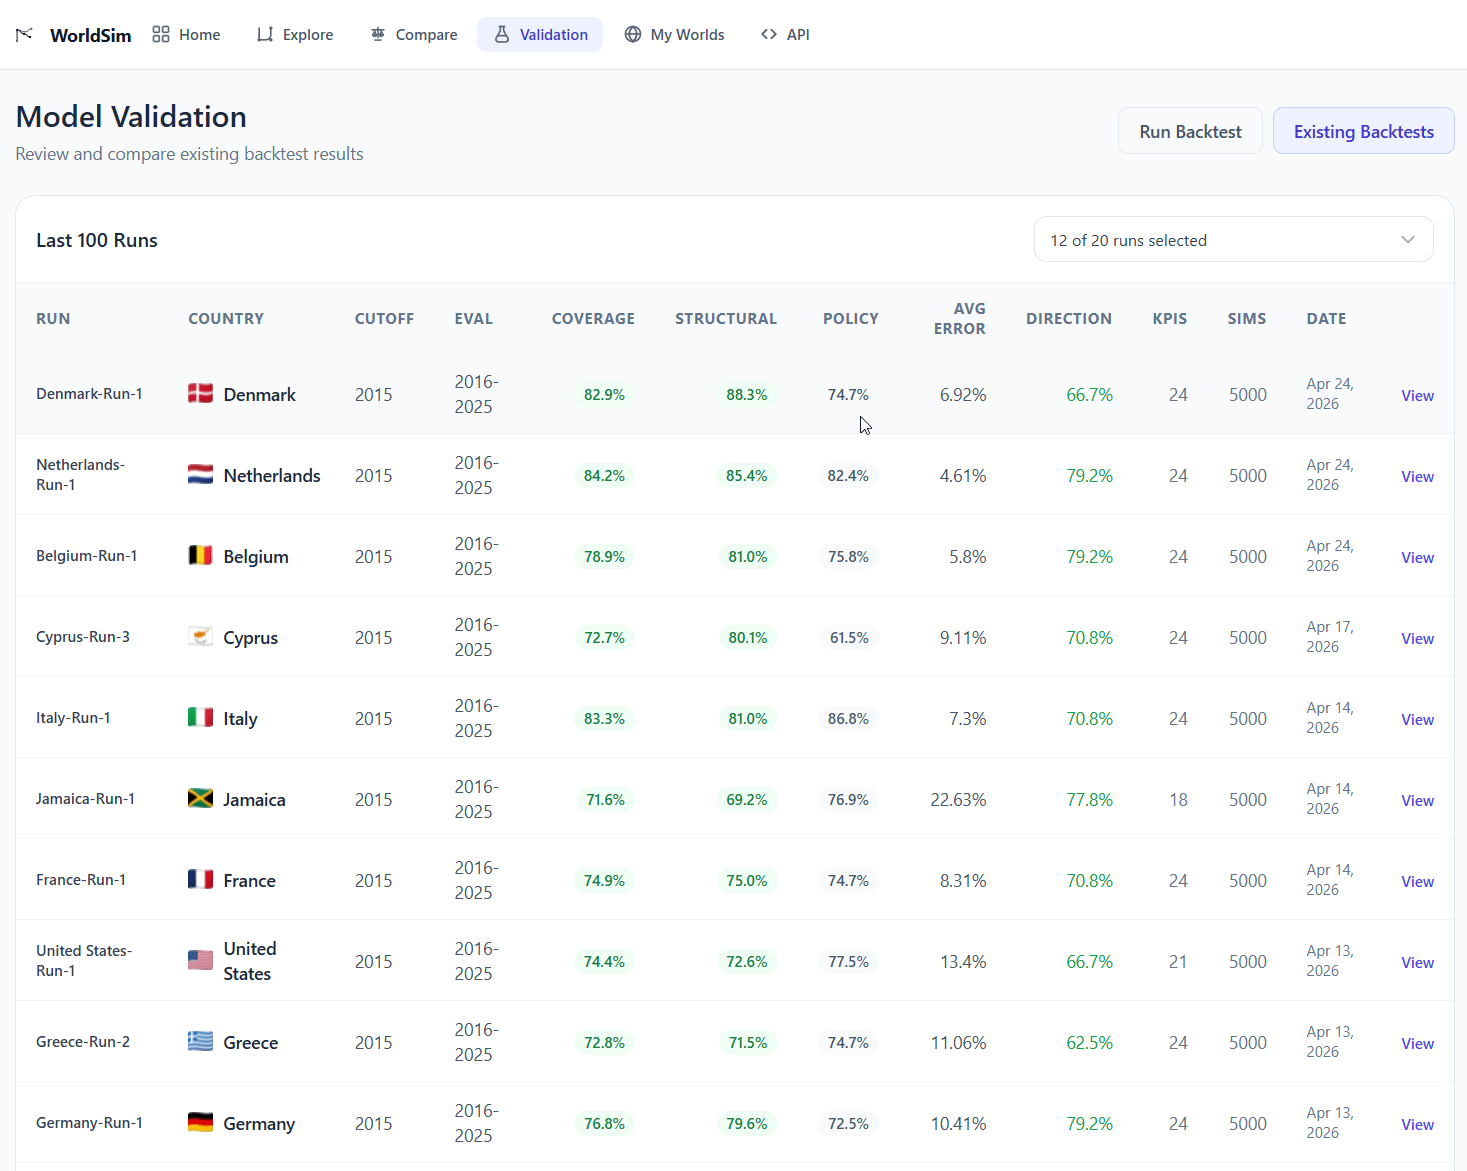
Validation chart: distributional coverage per KPI
Try it
The free tier runs three EU countries with basic KPI views. The professional tier opens all 195 countries and deeper drilldowns. Institutional and enterprise tiers add API access, raw Monte Carlo paths (CSV / Parquet), batch execution, and custom modules. Everything sits at worldsimlab.com.
If you work in government, a central bank, a multilateral, a hedge fund, a corporate strategy team, or an AI compliance function, I would like to hear what is missing and what would move WorldSim from ‘interesting’ to ‘must-have’ for your workflow. Comments are open and I read every one.
Thanks for reading.