Stop Predicting. Start Exploring.
Every long-horizon country forecast you have ever read is one path through a much wider distribution. The variance is the signal. We just made it visible.

Most economists predict a number. The world is a distribution.
Most institutions publish long-horizon country forecasts as a single line. GDP grows X% per year. Public debt reaches Y% of GDP by 2035. Population over 65 hits Z%. The number is precise, the methodology is conservative, and the report is impressive.
But that number is one path. The world the country actually lives in is a probability distribution around it, with variance that is often wider than the difference between any two competing forecasts. A 1.5% real GDP growth projection has a P10 below zero and a P90 above 4%. The variance is not noise. It is the actual signal a decision-maker needs.
The same problem repeats for every macro variable that matters. Inflation, fertility, public debt, energy independence, housing affordability. Each gets a single forecast. Each reality lives in a distribution. The gap between the two is where wrong policy decisions and wrong investment theses are born.
This is not a critique of any particular forecaster. The institutional models are excellent at what they do. They are simply built to deliver a central path under a default set of assumptions. They were never built for distributional exploration at scale, across 195 countries, with controllable scenario tilts and structural cascade rules. That is a different tool for a different job.
The argument of this article is that the second tool should exist, and should sit alongside the first.
Five structural problems with how we forecast countries
1. Single-path forecasts hide the variance.
A point forecast says the future will be X. The variance around X says the future could plausibly be 0.5X or 2X. When that variance is wide enough that any decision should be hedged differently across its tails, hiding it means hiding the decision-relevant signal. The central path is necessary. It is not sufficient.
2. Linear models miss thresholds and cascades.
Real economies are non-linear. Public debt at 100% of GDP behaves differently from debt at 80%. Renewable energy share above 30% triggers grid integration costs that do not exist below it. Population over 65 above 25% activates ageing-drag dynamics that are dormant at 20%. Total fertility below 1.3 enters a different policy regime than fertility at 1.5.
These thresholds are well-documented in the academic literature. Most institutional forecasts do not encode them as discrete cascades. They smooth them into linear elasticities. The result is a forecast that looks reasonable until the country crosses a threshold, at which point the model is silently wrong.
3. Black-box methodology kills reproducibility.
A central feature of credible scientific work is reproducibility. A central feature of most macro forecasts is the opposite. The methodology is partially documented. The data is partially gated. The assumptions are partially stated. The reader cannot re-run the analysis with different inputs and see how the output changes.
This is not the forecasters’ fault. It is a structural feature of how the work is consumed. Reports are published, decisions are made, and the underlying engine remains opaque. But it does mean that stress-testing any institutional forecast is effectively impossible from the outside.
4. Country-by-country bespoke models are not comparable.
Most major institutions publish country reports that are bespoke. Different teams. Different frameworks. Different assumption sets. The result: comparing Finland and South Korea on the same axes, or Greece and Romania on the same indicators, is harder than it should be.
For sovereign credit analysis, investment allocation, and policy benchmarking, comparability is the entire point. A framework that uses the same 26 KPIs and the same 100+ structural rules across 195 countries solves a different problem than a per-country bespoke report. Both are valuable. The market currently has too much of the latter and not enough of the former.
5. Macro outputs do not translate to decisions.
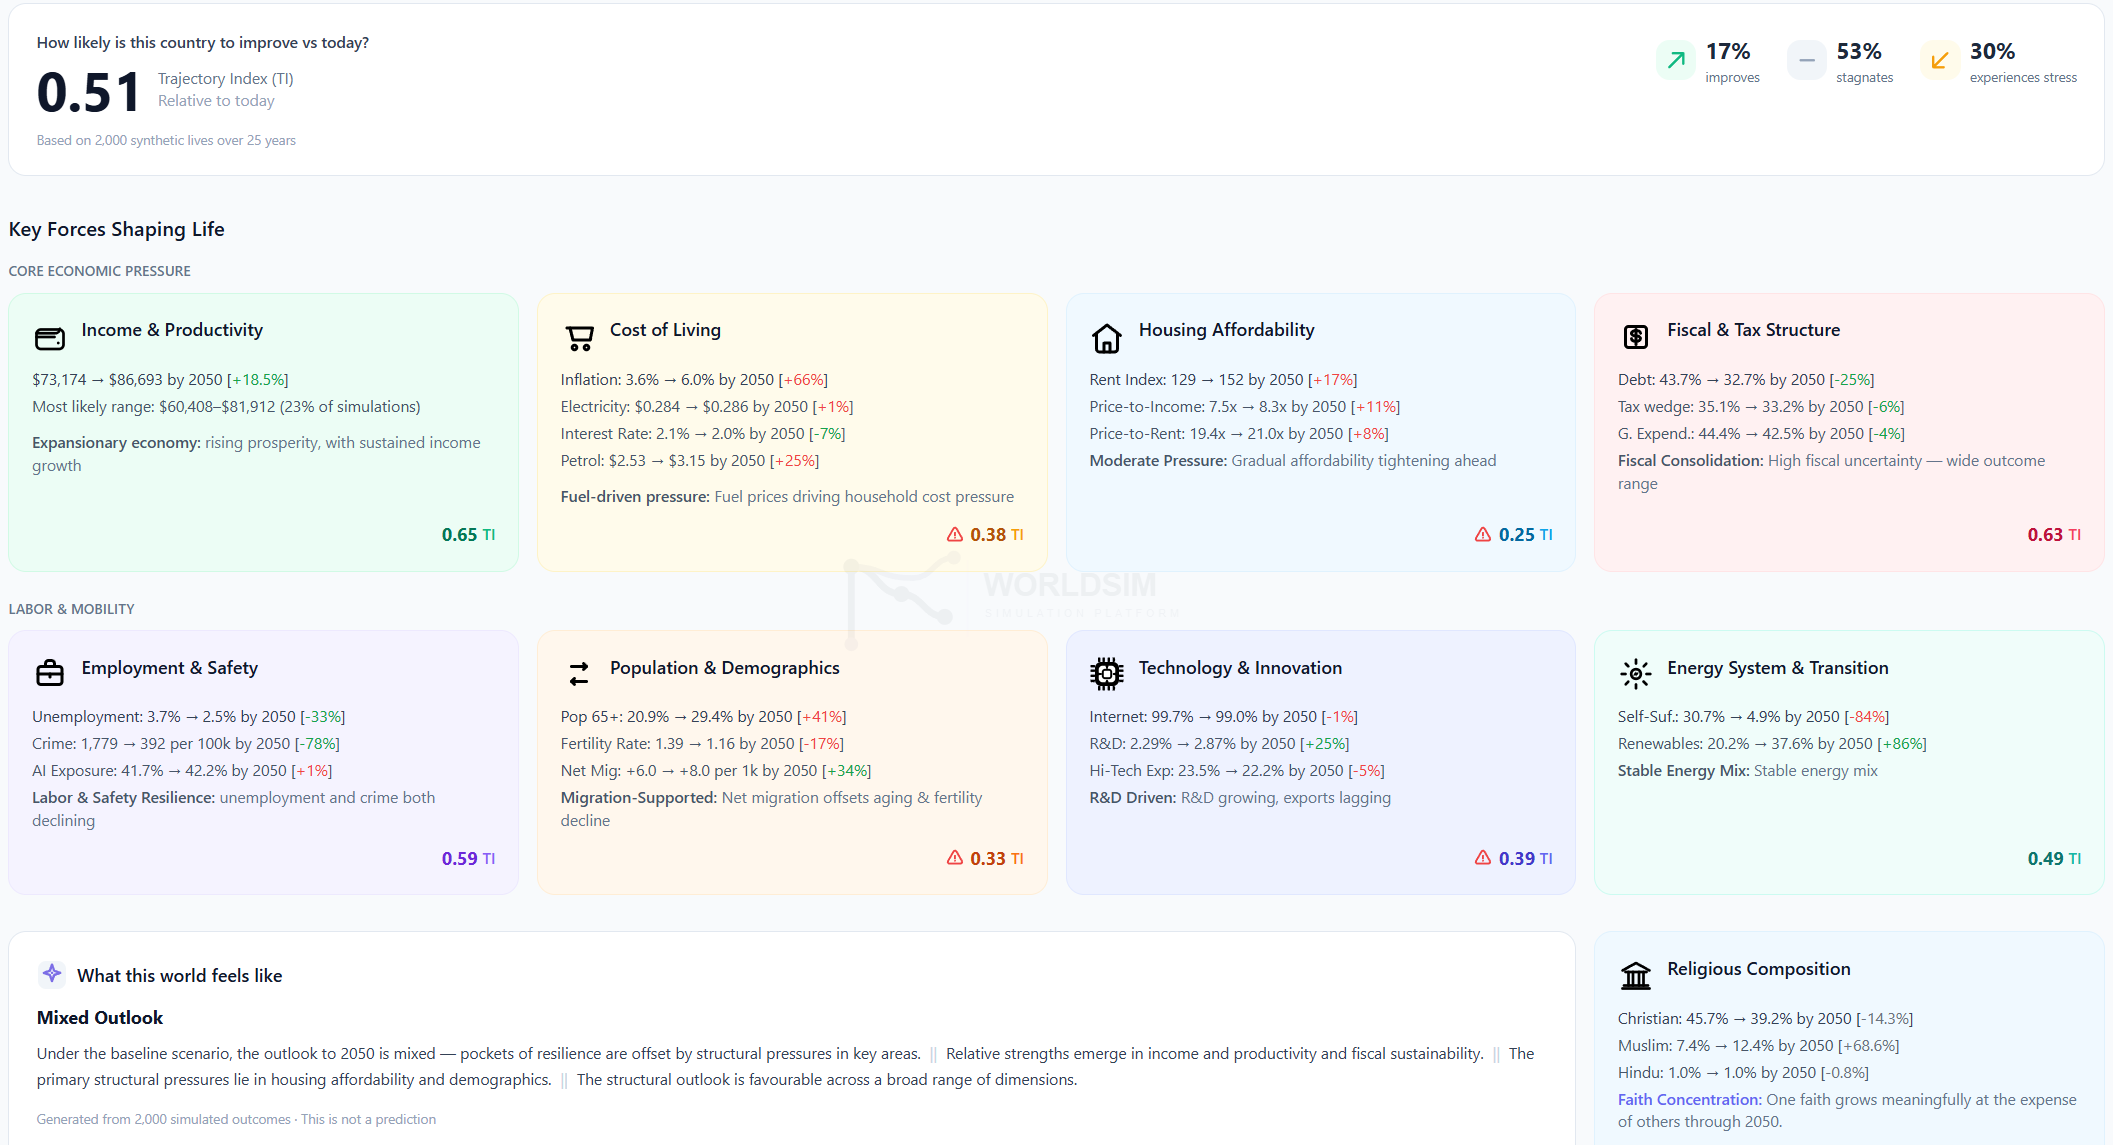
GDP per capita +0.6% per year is a number. What does this mean for a 30-year-old in Helsinki choosing whether to buy or rent? What does it mean for an emerging-market sovereign analyst sizing a position? What does it mean for a policymaker deciding whether a proposed tax wedge reform crosses a structural threshold? These are decisions. The gap between the macro number and the decision is the gap between forecasting and decision support.
Most macro forecasts stop at the macro layer. They do not project outward to the household, the firm, the investor, or the policymaker. The translation from GDP to lived experience requires a layer most forecasts do not include.
What a probabilistic macro engine should look like
Take the five problems above and invert them. The tool that solves them has seven properties.
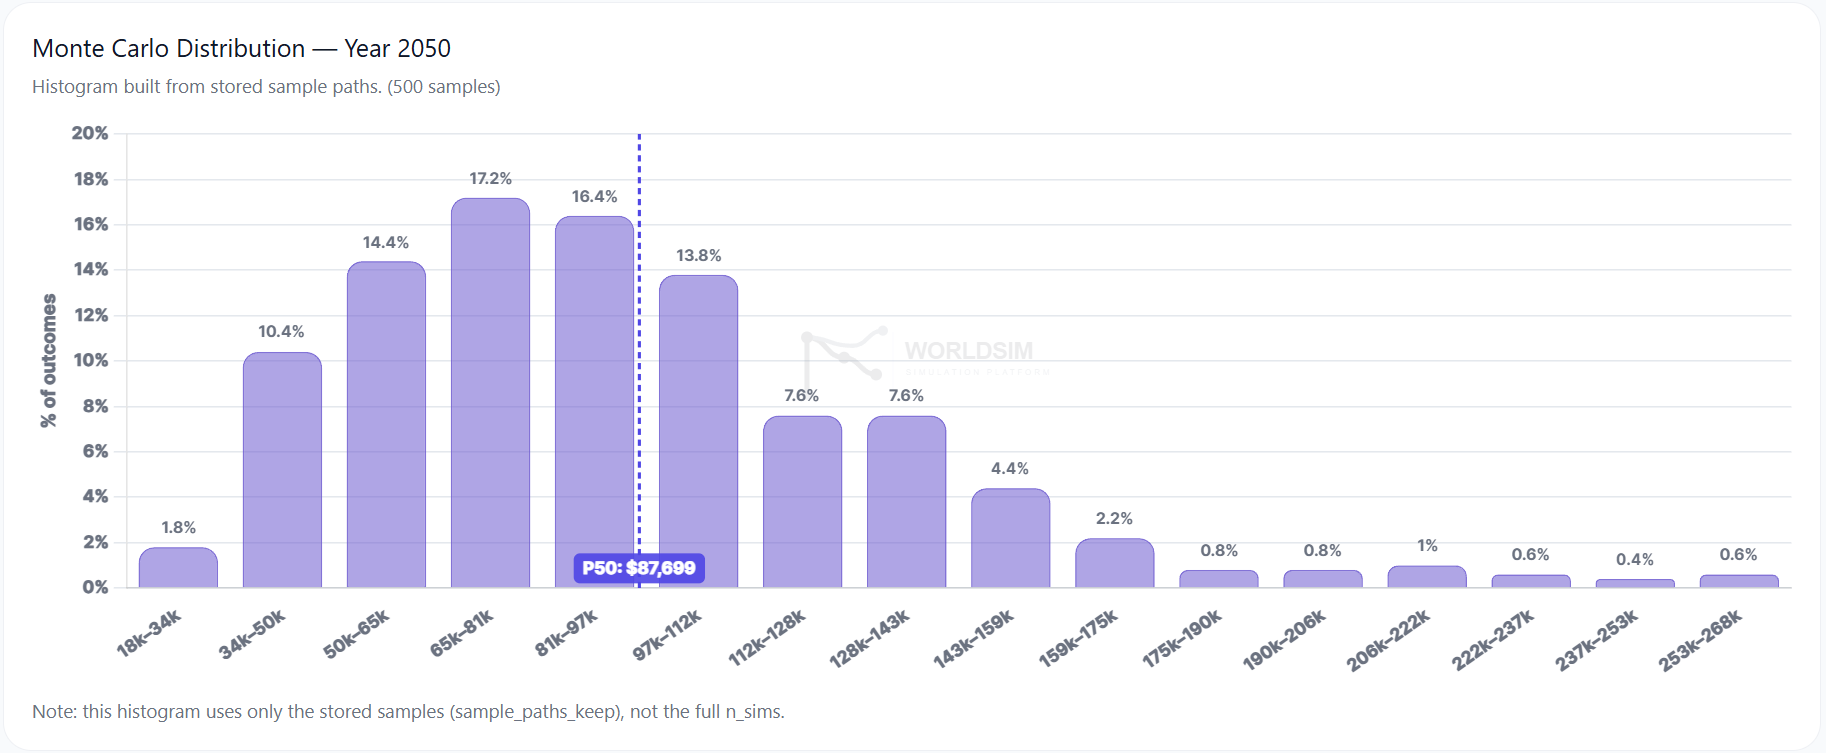
Probabilistic. Every forecast is a distribution. P10, P50, P90 published by default. Monte Carlo simulation at the core, not an afterthought.
Structural. Coupling rules with explicit thresholds, magnitudes, durations, decay logic, and academic references. Cascades are first-class objects, not smoothed away.
Reproducible. Every run has a seed and a run group ID. Same inputs always produce the same outputs. Methodology is open. Anyone can verify.
Comparable. Same 26 KPIs and same 100+ rules across 195 countries. Cross-country analysis is structural, not bespoke.
Multi-layered. Macro baseline → user bias overlay → scenario tilts → coupling rules → personal projection. Each layer is interrogable. Each can be turned off.
Long-horizon. Built for 2025 to 2050, not just the next five years. The questions that actually matter (demographics, climate, technology, AI) only resolve over decades.
Public. Free at the point of use. Not gated to consultancies. The scenario layer is too important to live behind a procurement process.
That is the brief. The question is whether such a tool exists.
That is what we built
WORLDSIM is a probabilistic socio-economic world simulation platform for long-horizon scenario exploration through controllable, reproducible synthetic environments.
Concretely: 195 countries, 26 KPIs, 100+ structural coupling rules, 5,000 to 10,000 Monte Carlo trajectories per run, P10/P50/P90 outputs on every variable, controllable tilts on every KPI, layered macro and personal projections, 2025 to 2050 horizon, public access at worldsimlab.com.
WorldSim is not a replacement for institutional forecasts. It is a scenario layer that sits on top of them. The institutional data layer (the World Bank, IMF, OECD, Eurostat, UN, national statistics offices) feeds the baseline. WorldSim takes those central paths as the starting point and opens up the distribution and the structural cascades around them. The two complement each other. The institutional baseline tells you the central forecast. WorldSim shows you the rest of the cone.

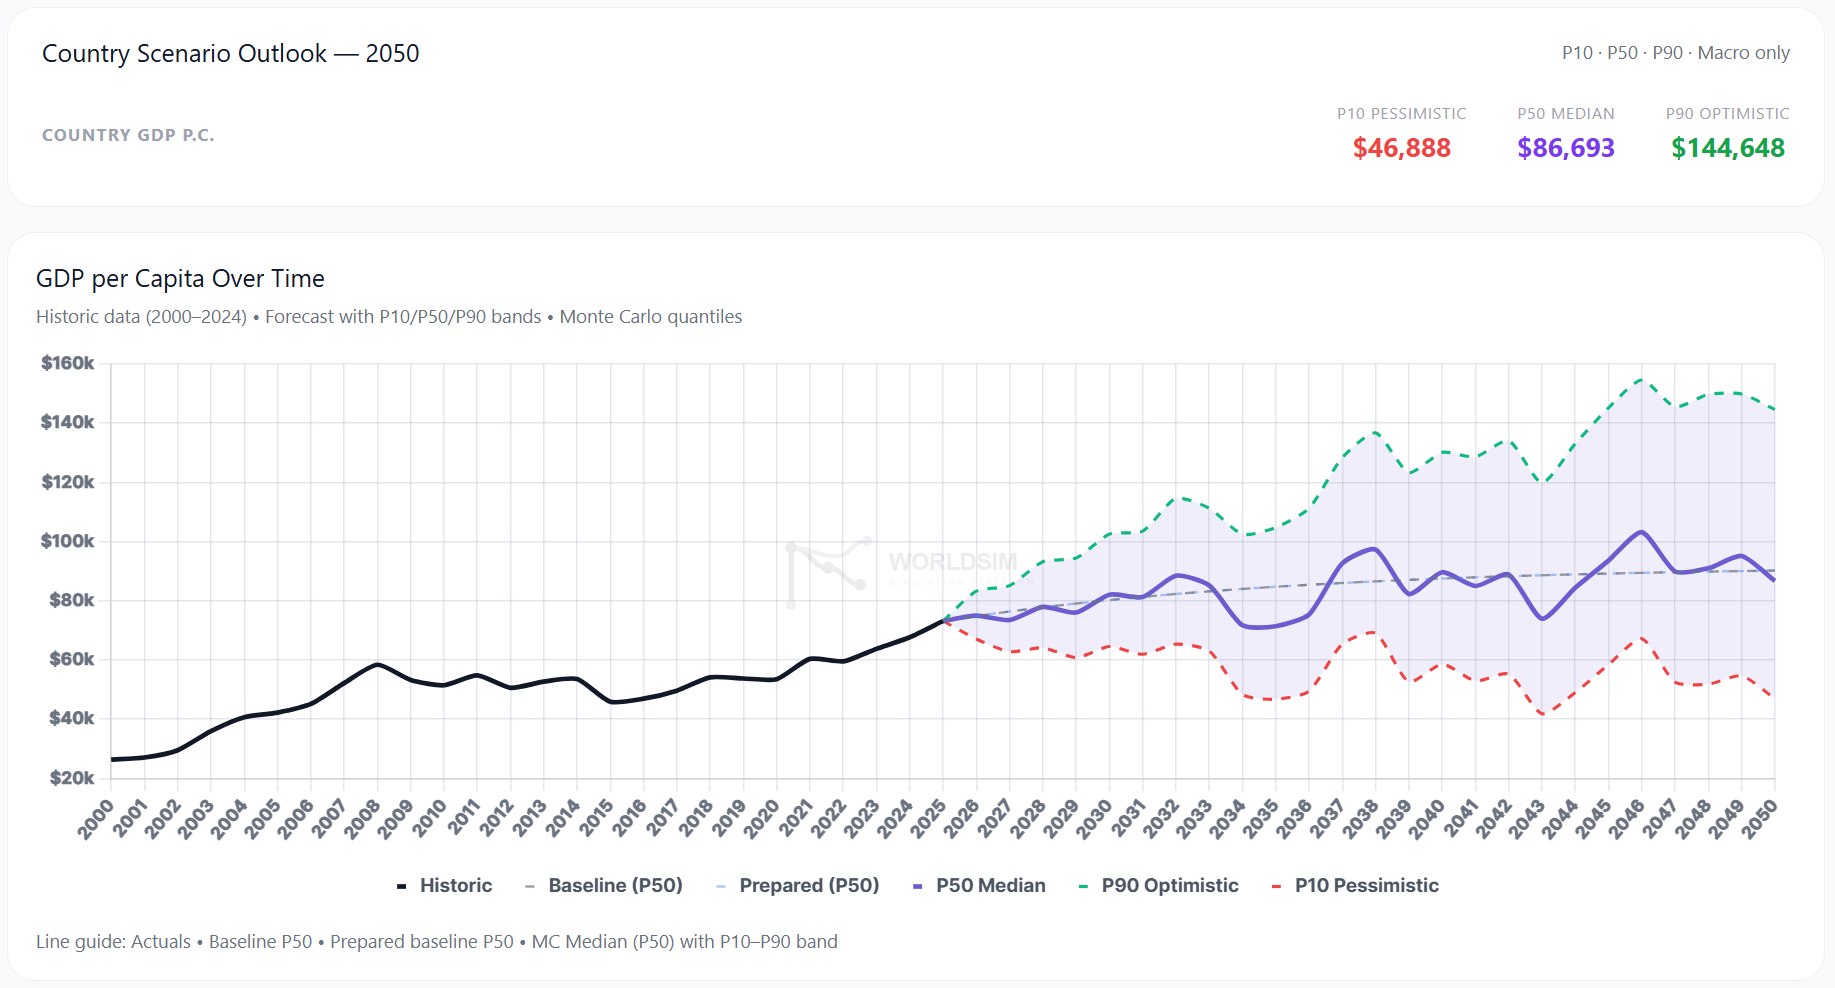
Example: a country GDP per capita forecast shown as a P10/P50/P90 fan with historic data, baseline central path, and Monte Carlo distribution across 5,000 trajectories.
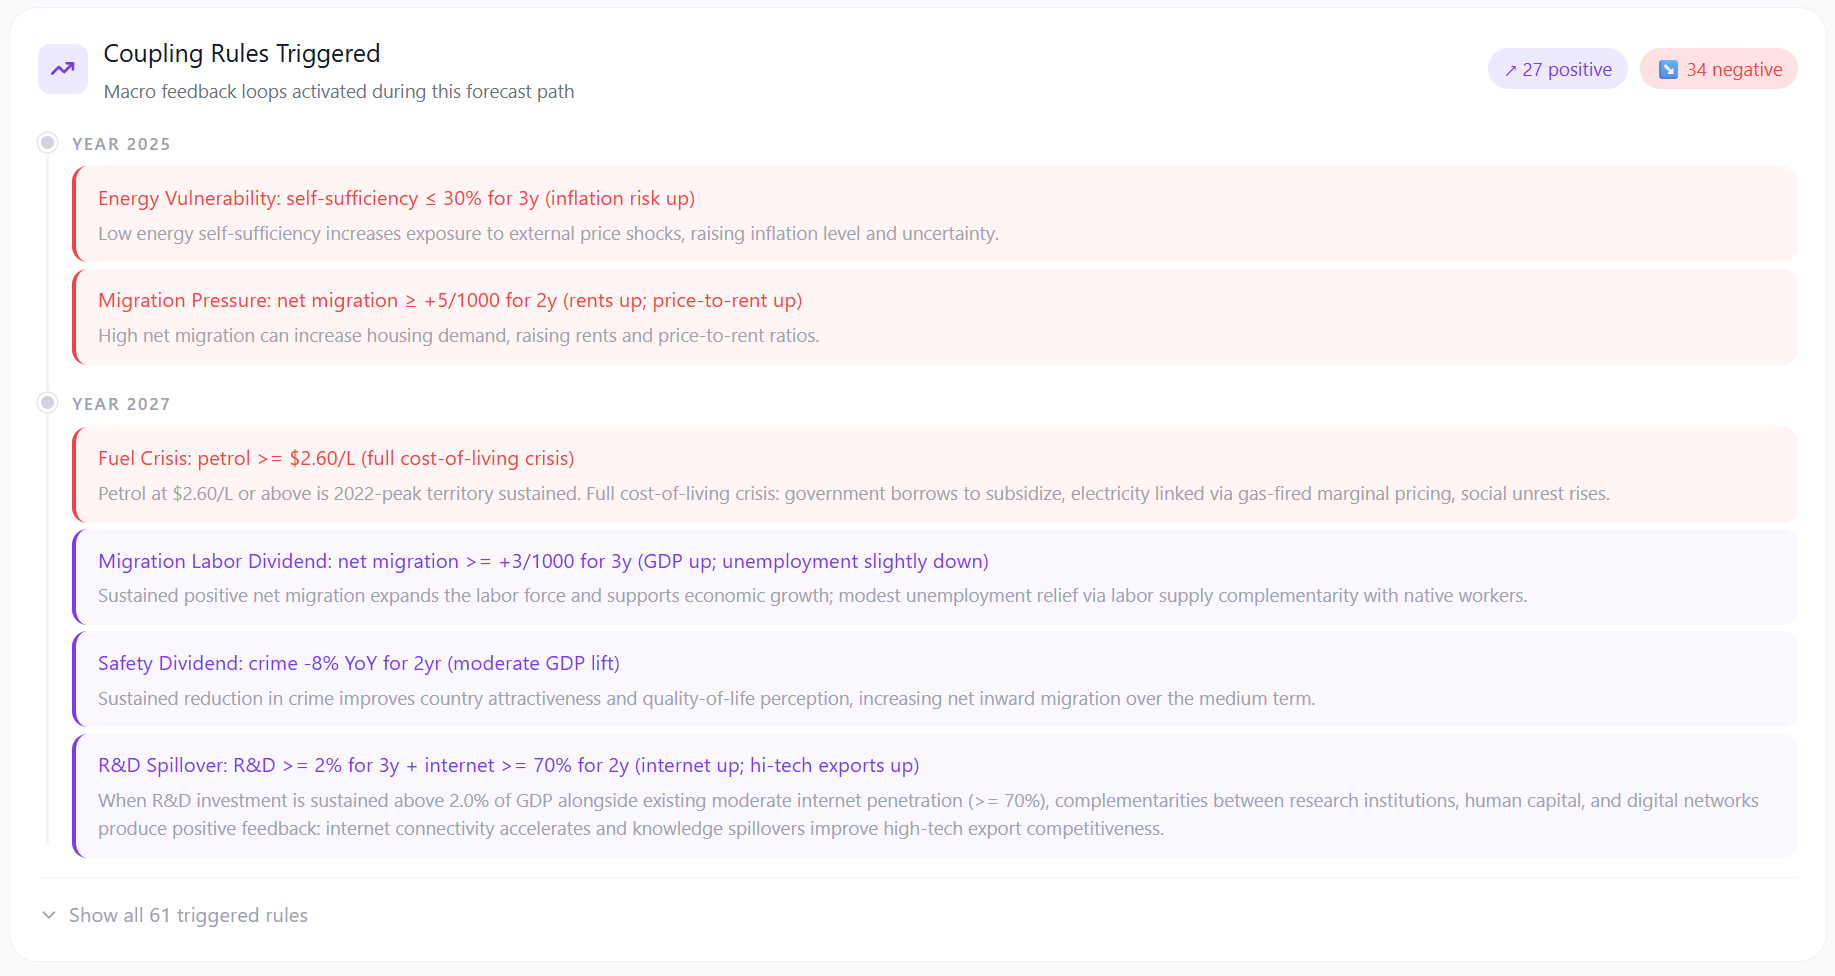
Example: a coupling rule cascade. A single trigger (debt > 100% of GDP for 3 years) activates downstream rules on tax wedge, public expenditure, and migration. Each rule has a magnitude, duration, decay, and academic citation.
What this lets you do
Five concrete use cases.
A sovereign analyst stress-tests a country’s debt trajectory before a credit decision, not against the central path but against the P10 tail and the structural rules that drive it.
An investor explores the variance band around a 10-year macro thesis, identifies which coupling rules drive the downside, and hedges accordingly.
A policymaker tests whether a proposed reform (a tax wedge change, a fertility incentive, a defence spending ramp) crosses a structural threshold in the model. If it does, the cascade is visible. If it does not, the reform is rounding error.
A journalist gets a probabilistic counter-baseline to the central forecast and can show readers what the variance actually looks like, with structural rules behind every claim.
A citizen runs their own country at 2050, applies their own scenario assumptions, and sees what the model does in response. Sovereignty over the assumptions matters.
Forecasting is not the same as exploration
Prediction asks: what will happen? Forecasting, done well, asks: across the plausible range of futures, what is the distribution of outcomes, and which structural rules govern the cascades between them?
Most long-horizon work to date has been built for prediction. The methodology is precise, the central path is defensible, the variance is invisible. That work is necessary. It anchors every conversation about a country’s future. We use it. We respect it. We build on it.
What WorldSim makes visible is the cone. Every long-horizon forecast you have ever read is one path through a much wider distribution. The variance was always the signal. We just made it explorable.
That is the difference between predicting the future and exploring it.
Try it yourself
Run any country at worldsimlab.com. Move the sliders. Apply your own scenario tilts. See every coupling rule that fires per year, with its full trigger logic and academic reference. The cone is open.
Data sources
WorldSim is built on top of the institutional data layer. The following sources feed every country baseline.
· World Bank — World Development Indicators
· International Monetary Fund — World Economic Outlook database
· OECD — Tax, housing, energy, labour, education statistics
· Eurostat — European statistical office
· UN Population Division — World Population Prospects
· UN Statistics Division — National accounts, indicators
· National statistics offices (Tilastokeskus, INE, ISTAT, Destatis, etc.)
· Numbeo — Cost of living and housing affordability indices (cross-checked)
· Coupling rule catalog with academic citations: worldsimlab.com/coupling-rules